Using the Visual Studio Remote Debugger
So there I was, facing an error on a QA server that I couldn’t replicate in my development environment. The only message returned from the web page was “There was an error processing your request.” How in the world was I supposed to trouble shoot it? Scenarios like this seem to happen all too often. It’s working in the local development environment, but not on the QA server. Luckily, Microsoft offers the Visual Studio Remote Debugger which allows you to debug your code running outside of the local development sandbox. The software you create can be debugged remotely on another PC through using the Attach to Process functionality in Visual Studio in conjunction with the Visual Studio Remote Debugger. Due to its utility in helping to diagnose hard to find errors, the Visual Studio Remote Debugger is a tool that every .NET should at least be aware of.
Steps to Use the Remote Debugger
These steps are written from the perspective of debugging code that has been deployed to a remote server that doesn’t have Visual Studio installed. Visual Studio 2017 versions were used for all phases.
-
Install the Remote Debugging Tool
Ensure that the version you install corresponds with the version of Visual Studio you are using to develop the solution. Here is the link to install the 2017 version of the tools. Install this software on the server that you are trying to debug the code on.
-
Build a Current Debug Version
Use Visual Studio to build a debug version of your deployable.
-
Deploy the Debug Version to the Server
Deploy the debug version of your deployable to the server.
-
Run Debugging Tools as Admin on the Remote PC
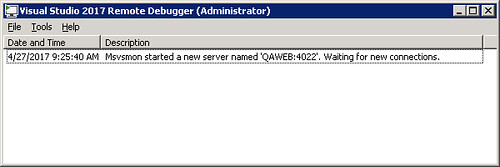
Make sure that you run the program as an administrator. Running the process as an admin will ensure that you’re able to attach to all processes running on the machine. The running program should look something like this:

-
Attach to Process Within Visual Studio
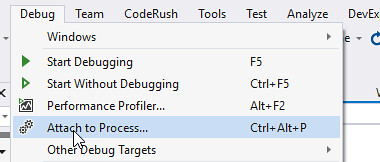
From the Debug menu, select the “Attach to Process…” option:

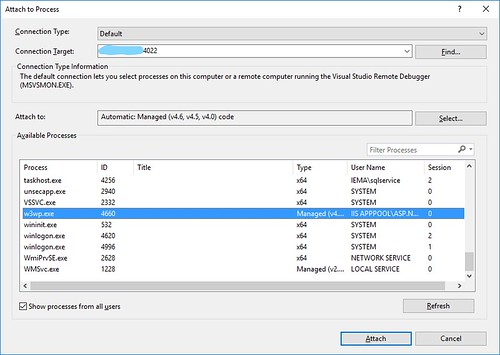
After clicking the “Attach to Process…” option, a blank version of the menu below will load. Enter the IP address or server name of the server that you want to connect to. The processes running on the server will be displayed. Select the process that you want to debug. I wanted to debug w3wp.exe since that is where the web application I wanted to debug was running.

Here you may have to sign in to an account that has admin permissions on the remote PC.
-
Set Break Points in Visual Studio
If everything has been completed correctly, the breakpoints should show up in solid red.

When the process isn’t attached correctly the breakpoint will be filled with white and say that it cannot be hit. You’ll have to go through the steps above to attach to the running code.

-
Trigger the Break Point and Debug the Code
Now you can step through the code and see exactly how the system is behaving. Identify the errors and get a plan together for how to resolve the problems.
Cases Where The Remote Debugger Has Been a Lifesaver for Me
- Self Developed dll Called from a Third Party Application
- Troubleshooting Deployed Executables
In the end, it turned out the error I was experiencing was very minor. The account being used to access the database on the QA server did not have access to secondary database that was being called via an insert trigger on one of our entities. Once the account was granted access to the secondary database, everything worked as planned. The Remote Debugging Tool made this error trivial to find and probably saved me a great deal of time.